![biarri-networks-logo.png]](https://fondhelp.biarrinetworks.com/hs-fs/hubfs/biarri-networks-logo.png?height=40&name=biarri-networks-logo.png)
Once FOND has generated your plan or design, the next step is to review it. This article covers the tools for doing that: the legend, the feature pop-up, the properties panel and the features table. It ends with a recommended workflow for reviewing a fiber network tier by tier.
We use a lot of FOND-specific terms here. If any are unfamiliar, see the network design elements glossary. For zooming, panning, searching and measuring, see Moving around the map in FOND.
Inspect a feature
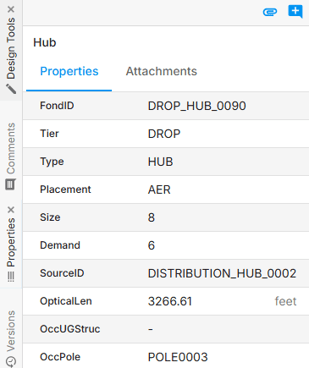
Click any feature on the map, whether it’s input data or part of your plan or design. Its attributes open in the properties panel.
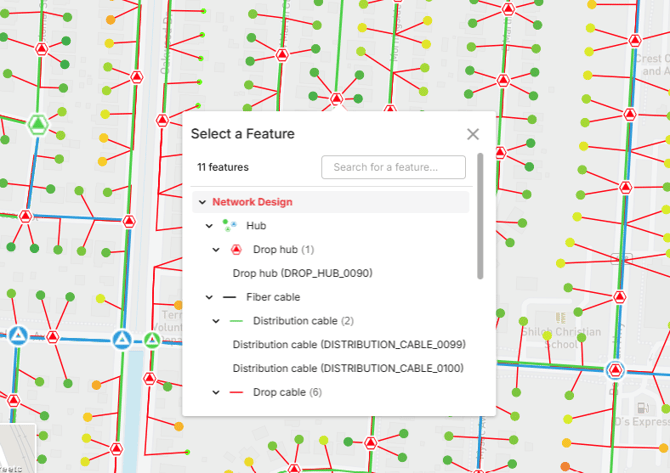
If there are several features where you clicked, FOND shows a Select a Feature list instead:
- The list is grouped by layer, such as Network Design › Hub › Drop hub, and shows how many features are in each group.
- To find a feature quickly, type in Search for a feature….
- Click a feature in the list to open its attributes in the properties panel.
Use the legend
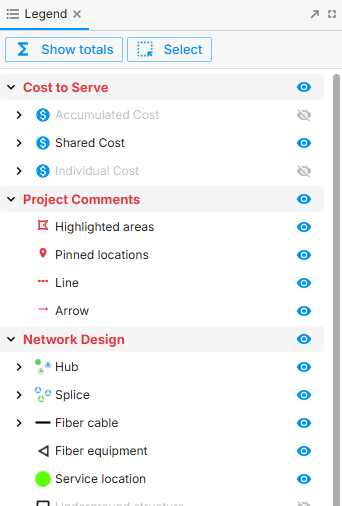
The legend lists every layer on the map, grouped under headings such as Input Data, Network Design, Cost to Serve and Project Comments.
View sub-groups
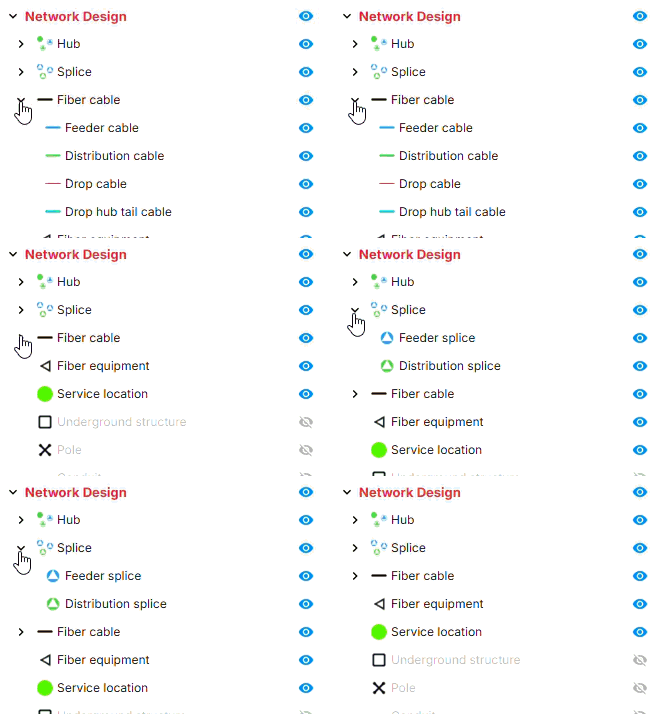
Some layers, such as Hub, Splice and Fiber cable, are grouped by tier. Click the arrow beside a layer to expand it and see its sub-groups, such as drop, distribution and feeder.
 Show layer totals
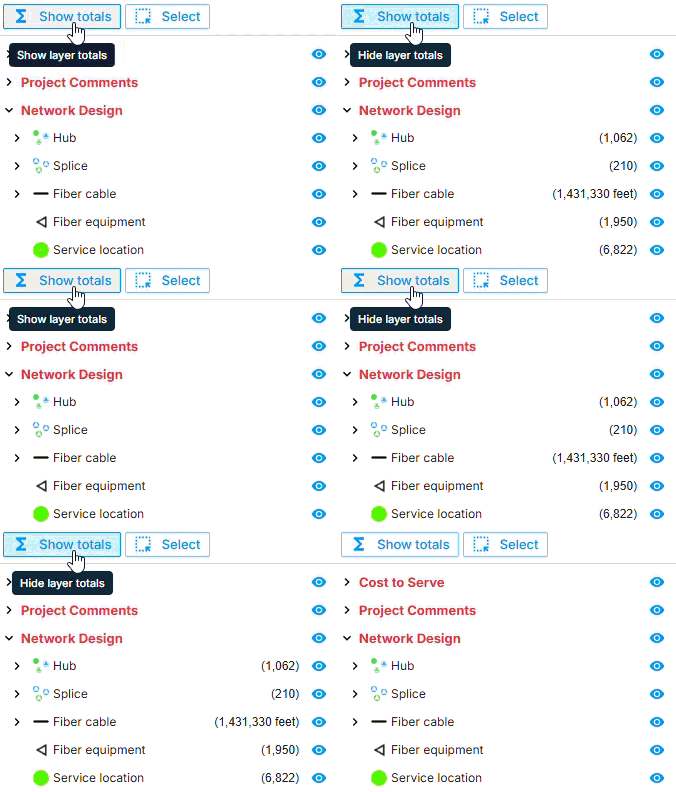
Click Show totals at the top of the legend to see the total count, or total length, for each layer. This gives you a quick snapshot of what’s in your input data and your plan or design. Click it again to hide the totals.
Turn layers on and off
Click the eye icon beside a layer to show or hide it. Hiding layers you don’t need makes it easier to see, and click on, the features you’re interested in.
A few rules keep the legend consistent:
- Hiding a group hides everything in it.
- Showing a layer inside a hidden group also turns on the group, but only that layer appears. The group’s other hidden layers stay hidden.
Shortcuts for managing many layers
Show one layer, or its whole group: Shift-click its eye icon.
- If most layers in the group are showing, Shift-click shows only the layer you clicked and hides the rest.
- If most are hidden, Shift-click shows every layer in the group.
Shift-click the same eye again to switch back. This is the quickest way to focus on one layer and then bring back everything around it.
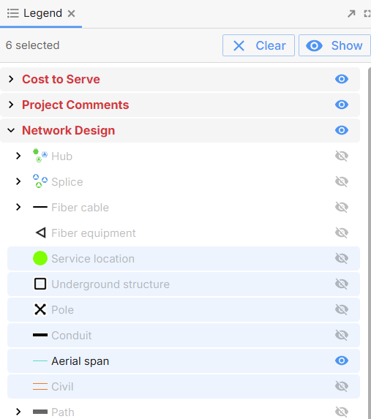
Show or hide several layers at once: select them first. Click a layer’s name (not its eye icon) to select it, then:
| To… | Do this |
|---|---|
| Select one layer | Click its name. Click it again to deselect it. |
| Select a range of layers | Click the first layer, then Shift-click the last. |
| Add or remove a layer | Ctrl-click its name (Cmd-click on Mac). |
When layers are selected, the top of the legend shows how many you’ve selected, plus two buttons:
- Show/Hide applies to all the selected layers at once. It offers Hide if they’re all visible, and Show otherwise.
- Clear deselects them all. Clicking anywhere outside the legend also clears the selection.
View attributes for all features in a layer
Rather than clicking features one at a time, use the features table to see every feature in a layer and its attributes in a table. In the default project layout, open it from Features at the bottom left of the screen. You can resize and move the table.
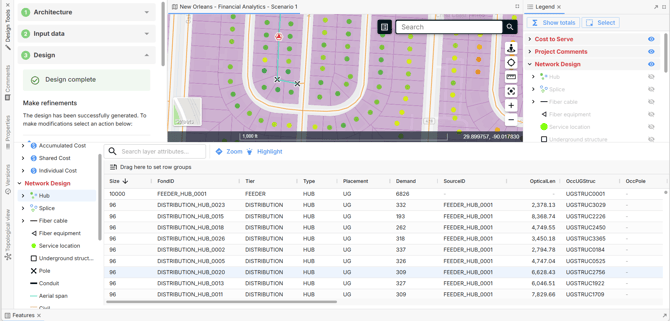
Select a layer or sub-group from the list on the left. Then you can:
- Search for attribute values, such as a feature with a specific FondID, or parcels with a particular land use.
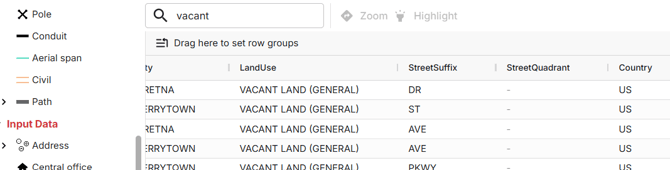
- Filter any column in the table to show only the features that match your criteria.
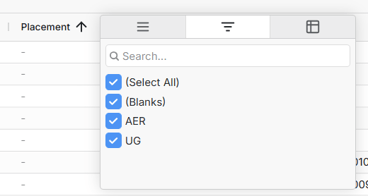
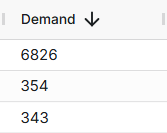
- Sort by any column. Click its heading to sort ascending, and click again for descending.
- Group features that share a value in a column, for example cables by size. Simply drag one or more columns into this area:

- Highlight or Zoom to the features you’ve selected. Select one or more rows, then click Highlight to pick them out on the map, or Zoom to move the map to them.
Common uses for the features table:
- Find addresses with a particular address type.
- Find service locations and hubs with a long OpticalLen.
- Find hubs with a low Demand count, which signals low utilization.
- Find cables over a certain length.
Recommended workflow: review a fiber network tier by tier
Reviewing one tier at a time keeps the map readable and makes problems easier to spot. For each step, use the legend to show only the layers listed (Shift-click helps here), then work through the checks.
Step 1: Drop network
| Show | Check |
|---|---|
| Service locations, Drop cables, Drop hubs | Are drop hubs using as much of their capacity as possible? Some underused hubs are unavoidable where addresses are sparse. Are any drops too long because address points are far from the underground path or poles? This is often only obvious once you see the design. |
Step 2: Distribution network
| Show | Check |
|---|---|
| Drop hubs, Distribution cables, Drop hub tail cables, Distribution splices, Distribution hubs | Are distribution hubs central and in constructible locations? Are splices kept to a minimum? |
Step 3: Feeder network
| Show | Check |
|---|---|
| Distribution hubs, Feeder cables, Feeder splices, Feeder hubs | Is the feeder cable path efficient and constructible? FOND tries to follow the distribution cable path where it can, but that may not be the route you want for the trunk cable. Are splices kept to a minimum? |