![biarri-networks-logo.png]](https://fondhelp.biarrinetworks.com/hs-fs/hubfs/biarri-networks-logo.png?height=40&name=biarri-networks-logo.png)
The bill of materials (BOM) lists every material your plan or design needs, with quantities and costs. FOND counts the quantities from your design and prices them using your BOM rules.
The interactive BOM shows your total construction cost, how it breaks down, and how cost varies across the premises you serve. You can also export the BOM as a CSV file.
Which projects have a BOM?
| Project type | View the BOM | Export BOM.csv | Where the BOM rules come from |
|---|---|---|---|
| Fiber Planner | ✓ | ✓ | Your architecture’s BOM tab |
| Fiber Design | ✓ | ✓ | Your architecture’s BOM tab |
| Power Design | ✓ | ✓ | A standard set of rules, which you can’t edit (yet) |
The BOM is available once you’ve generated a plan or design.
Open the BOM
- Any project: in the project menu, choose Attachment › Bill of Materials.
- Fiber Design and Power Design: in the design panel, go to Artifacts › Bill of materials.
The BOM opens in a full-screen window. Close it with X or Close.
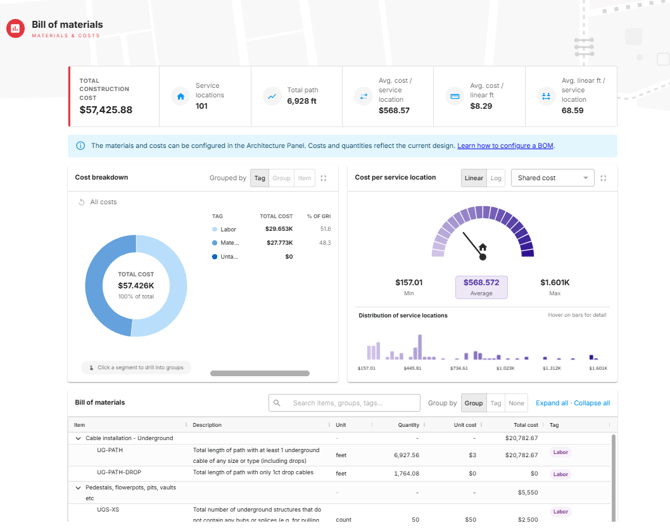
Summary figures
The top of the BOM shows the key figures for your plan or design:
| Figure | What it shows |
|---|---|
| Total construction cost | The total of every item in the BOM, in your project’s currency |
| Service locations | The number of premises served (meters, in Power Design) |
| Total path | The total route length, in your project’s units |
| Avg. cost / service location | Total cost divided by the number of premises served |
| Avg. cost / linear ft (or m) | Total cost divided by the total route length |
| Avg. linear ft (or m) / service location | Route length per premises served |
A dash (–) means the figure isn’t available for this project.
Cost breakdown
The Cost breakdown chart shows where your money goes.
- It starts by showing costs by tag, which are the categories in your BOM rules.
- Click a segment, or a row in the list beside the chart, to drill down from tag to group to individual items.
- Use the breadcrumb (All costs › …) or Reset to go back up.
The center of the chart shows the total for what you’ve selected and its share of the overall cost. Click Zoom in on this panel for a larger view.
Cost per service location
The Cost per service location chart shows how the cost of connecting each premises varies across your plan or design. Choose a Cost type:
- Shared cost (default): Each premises’ own cost plus its share of the network upstream, with shared equipment split in proportion to use
- Accumulated cost: Each premises’ cost including the whole upstream network, as if it were the only premises built
- Individual cost: The cost that comes from that premises alone
The gauge shows the minimum, average and maximum. The histogram shows how many premises fall into each cost band. Hover over a bar for details, and switch between a Linear and Log scale.
Use this chart to spot expensive outliers. To see where they are on the map, use Cost to Serve. See What is Cost to Serve?.
The bill of materials table
The table lists every item in your BOM, with its group, description, unit, quantity, unit cost, total cost and tag.
- Search for an item, group or tag.
- Group by group (the default), by tag, or not at all. Use Expand all and Collapse all to open or close the groups.
- Sort or resize any column.
Items with a quantity of zero aren’t shown.
To see just the table, switch from Analytics to Grid at the top of the window.
Change your BOM rules
(Fiber Planner and Fiber Design)
The BOM is read-only, so you can’t edit quantities or costs here. To change them:
- Edit the BOM rules in your architecture’s BOM tab, and save. See Configuring your BOM.
- A message on the map tells you that your BOM rules have changed. Click Update BOM.
Update BOM recalculates only the quantities and costs. It doesn’t regenerate your plan or design, so it doesn’t use any premises from your subscription.
Each project version has its own BOM, so update each version you need.
Export the BOM as a CSV
- In the project menu, choose Export, then Create new export.
- Enter a name, and choose a version if your project has more than one.
- Under Add to Export, tick Material & Costs.
- Select at least one map layer as well.
- Click Export.
When the export is complete, download the ZIP file. Your BOM is in BOM.csv. See Export a project.
If you’ve changed your BOM rules, click Update BOM before you export. Otherwise the file shows the old costs.
What’s in BOM.csv
| Column | Contains |
|---|---|
| Group | The BOM group, for example Equipment or Cables |
| Id | The item ID from your BOM rules |
| Description | The item description |
| Unit | For example count, feet or meters |
| Quantity | The quantity counted from your design |
| Unit Cost | The cost per unit, from your BOM rules |
| Total Cost | Quantity × unit cost |
| Tags | The item’s tags, separated by commas |
How the file differs from what you see on screen:
- It includes items with a quantity of zero, which are hidden on screen.
- It has no total or subtotal rows. Add them in your spreadsheet if you need them.
- Costs are plain numbers, with no currency symbol.
Troubleshooting
| Message | What it means |
|---|---|
| To see the bill of materials for this project, first generate a design. | There’s no plan or design yet. Generate one first. |
| Project is currently running | A plan or design is generating. The BOM opens once it’s finished. |
| The bill of materials could not be loaded. | In Power Design, this also appears before the design has been generated. |