![biarri-networks-logo.png]](https://fondhelp.biarrinetworks.com/hs-fs/hubfs/biarri-networks-logo.png?height=40&name=biarri-networks-logo.png)
A financial report has three pages, listed down the left: Overview, Cost and Revenue. Settings shows the assumptions you used. To go back to the project, click Design project.
Overview
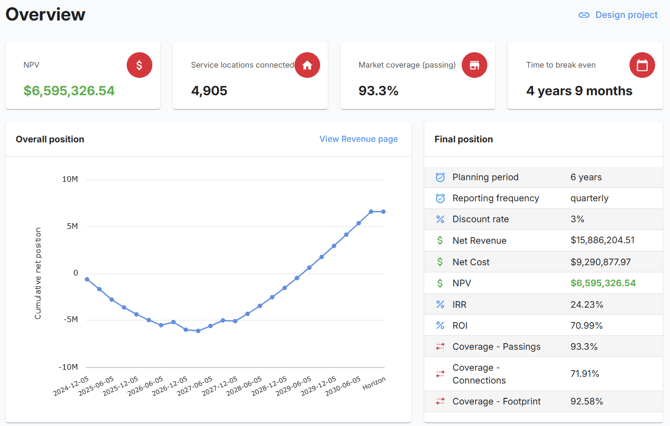
The summary shows your headline results:
- NPV, Service locations connected, Market coverage (passing) and Time to break even
- Overall position: your cumulative net position over time. Where it crosses zero is your break-even point.
- Final position: every key result in one table
- Cost breakdown: construction cost by BOM category
- Cost per service location: the minimum, average and maximum
If the results look unusual, for example a negative NPV, nothing built, or everything built in the first phase, a tip explains the likely cause. See Troubleshoot financial reports.
Cost
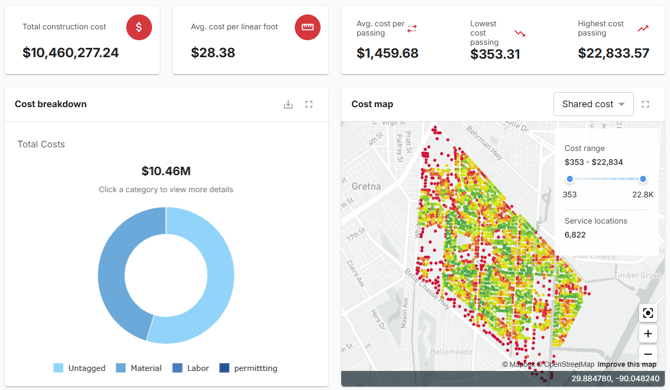
- Summary figures:
- Total construction cost
- Average cost per foot (or meter) and per passing
- The lowest- and highest-cost passings
- Cost breakdown: click to drill down from total cost to each category and item
- Cost map: service locations colored by Shared, Individual or Accumulated cost. Use the Cost range slider to focus on a band. See Cost to Serve.
- Data: every cost item, ready to download
Revenue
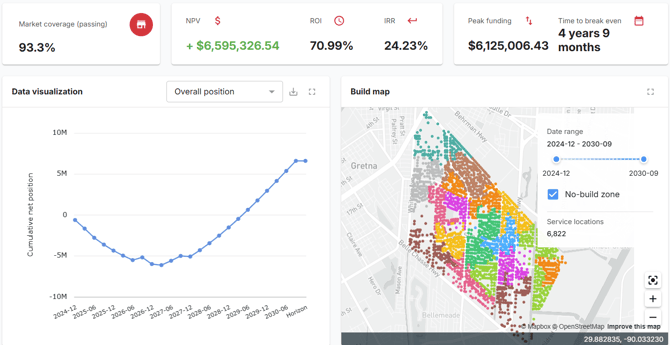
- Summary figures: market coverage, NPV, ROI, IRR, peak funding and time to break even
- Data visualization: switch between overall position, revenue projection, cost projection, projected connections and projected passings
- Build map: which service locations are built in each phase. Drag the Date range slider to watch the build unfold. Tick No-build zone to show the locations that won’t be built within the planning period.
- Data: the schedule behind each chart
What the results mean
| Result | Meaning |
|---|---|
| NPV (net present value) | Revenue minus cost over the planning period, in today’s money |
| IRR (internal rate of return) | The annual return the build earns. Compare it with your discount rate. |
| ROI (return on investment) | The discounted return, as a percentage of what you spend |
| Peak funding | The most money you’ll need at any point before revenue catches up |
| Time to break even | How long until your cumulative position turns positive |
| Coverage | The share of passings, connections and footprint reached within the planning period |
How FOND builds in phases
FOND builds each distribution hub, and everything it serves, as one unit (or each drop hub, for small plans). It chooses the order based on your objective and your resource limits for each period.
Download charts and data
- Charts: download as PNG.
- Data tables: download as Excel. The schedules include homes passed, homes connected, revenue, cost and cash flow, each by phase, with an All summary row.
Lengths follow your project’s units (feet or meters). All money is shown in $.
Change or regenerate a report
- Open Settings and click Edit.
- Change your assumptions, then click Regenerate report.
If you see The passings and service location data are outdated, your design has changed since the report ran. Regenerate the report to update it.
Share, move or delete
Reports have their own sharing. They follow the folder they’re saved in, not the project they were made from. Use the report’s menu in your project list to Rename, Move, Share or Delete it. See Share a project or folder.