![biarri-networks-logo.png]](https://fondhelp.biarrinetworks.com/hs-fs/hubfs/biarri-networks-logo.png?height=40&name=biarri-networks-logo.png)
Splice tables record what happens to every fiber at every hub and splice point in your design: whether it’s spliced, split, passed through, or left spare. FOND creates them automatically each time it generates your design.
You can work with splice tables in two ways:
- The Splicing view: an interactive diagram of your network that’s linked to the map. It’s best for reviewing and tracing connections.
- A CSV export: a fiber-by-fiber table to share with splicing crews or load into other tools.
Splice tables are available in Fiber Design projects.
Why not Fiber Planner? Fiber Planner plans are for feasibility studies, not construction, so they don’t produce splice tables. You can still count splices in your Fiber Planner BOM, since splicing is a significant construction cost. See Configuring your BOM.
When splice tables are updated
Splice tables reflect the last time your design was generated.
- Refinements don’t update them straight away. After moving hubs, editing drop assignments or adding blockers, click Update design to refresh the splice tables.
- New versions start with a copy. When you continue from a version, its splice tables are copied with it.
The Splicing view
Open the Splicing view
Either:
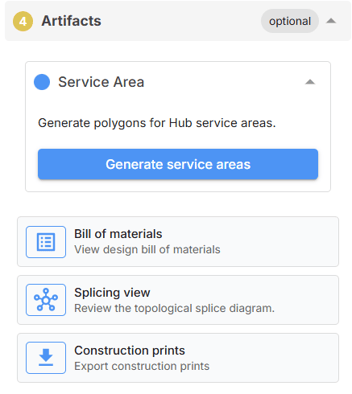
- Go to the Artifacts step and click Splicing view, or
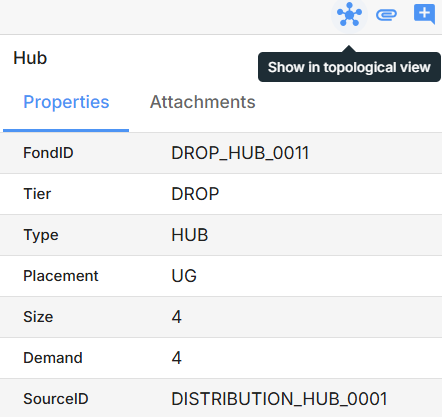
- Select a hub, splice point or cable on the map, then click Show in topological view in its properties.
The view opens in a Topological view tab, which you can close when you’re done.
 |
 |
Read the diagram
The diagram runs from left to right, starting at your network’s source:
- Each box is a hub or splice point, titled with its ID.
- Each arrow is a cable, labelled with its ID.
- Premises aren’t drawn as boxes. They’re listed in the Service Location column of the hub that serves them.
Inside each box, a table shows what happens to the fibers there:
| Column | Shows |
|---|---|
| Cable In / Fiber In | The incoming cable and fiber |
| Cable Out / Fiber Out | The outgoing cable and fiber |
| Service Location | The premises served, for drop connections |
To keep the tables short, FOND groups fibers:
- Ranges: Consecutive fibers are combined, for example F1-8.
- Splits: A split is shown as one fiber feeding several, for example 1 → 1-4.
- Spare and dead fibers: These show as SPARE, SPARE (x4) or DEAD.
An icon beside each fiber shows whether it’s spliced, split, or passes through without being split or spliced. Hover over it to see which.
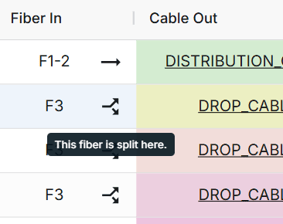
Cables are shaded in different background colors so you can tell them apart within a box. These shades aren’t fiber color codes.
Find your way around
- Pan and zoom with your mouse or the zoom controls. Use fit view to see the whole diagram. You can drag boxes by their titles to rearrange them.
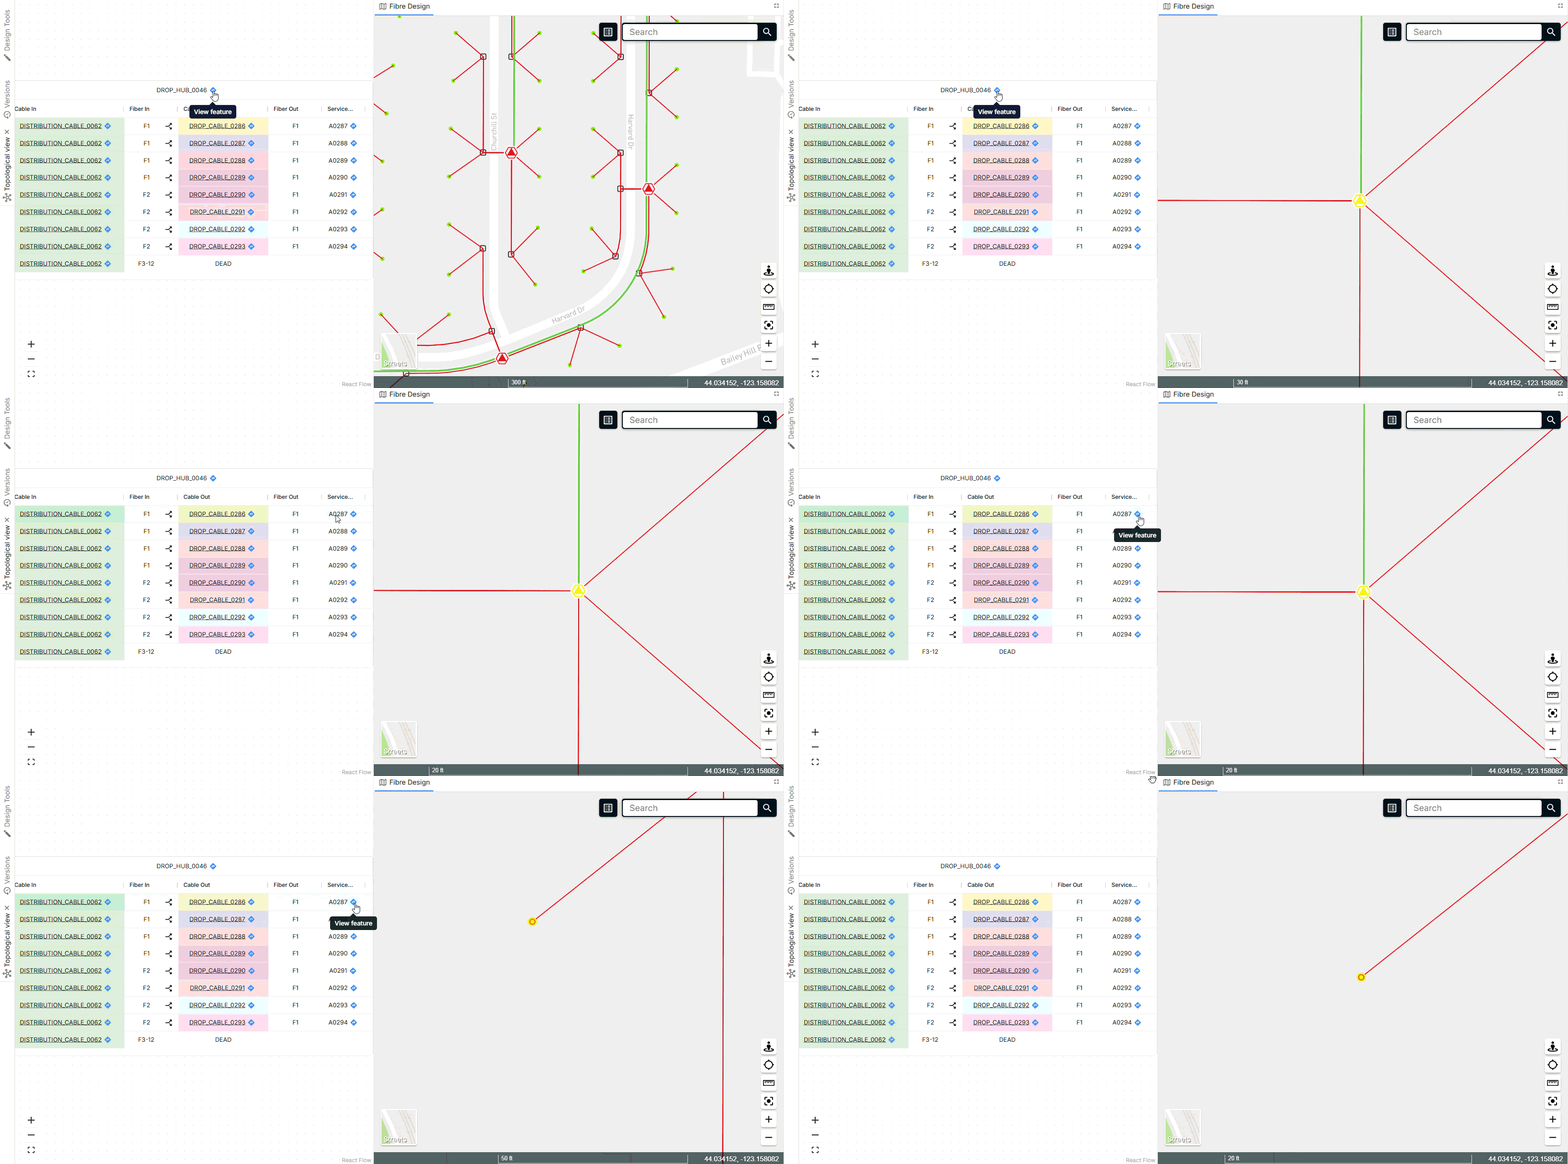
- Follow a cable: Click a cable name in a table to jump to the box at the other end. The map zooms to the cable and highlights it.
- See a feature on the map: Click View feature on a box title, cable or premises to select it on the map and open its properties.
- Sort, resize and filter the table columns to find a cable or service location.
Export splice tables as a CSV
- In the project menu, choose Export, then Create new export.
- Enter a Name, and choose a version if your project has more than one.
- Under Add to Export, tick Splice Tables.
- Select at least one map layer as well.
- Click Export.
When the export shows Complete!, download the ZIP file from Project Exports. Your splice tables are in SpliceTables.csv.
Splice Tables is greyed out until you’ve generated a design. See Export a project.
What’s in the CSV
The CSV has one row for each fiber at each hub and splice point, showing the incoming and outgoing cable and fiber, their tiers, and what happens to the fiber there: splice, split, express, spare or dead. It doesn’t include fiber or tube colors, port numbers or addresses.
For a row-by-row guide with worked examples, see Understanding the splice tables.
Troubleshooting
“The topological view cannot currently be displayed.” This means either no design has been generated yet, or the design outputs were changed after the design ran, so the view can’t match them to the map. Generate or update the design, then try again.