![biarri-networks-logo.png]](https://fondhelp.biarrinetworks.com/hs-fs/hubfs/biarri-networks-logo.png?height=40&name=biarri-networks-logo.png)
Market Lens helps you decide where to build. It takes a large area, such as a city, county or region, divides it into smaller subareas, and scores each one on cost and revenue factors such as density, income and existing fiber coverage. You can then turn the most promising subareas into Fiber Planner projects and compare their business cases in one place.
This guide takes you through the whole Market Lens workflow once. Each step links to a more detailed article for when you’re ready to go further.
How Market Lens differs from Fiber Planner
| Fiber Planner | Market Lens | |
|---|---|---|
| Answers | What should we build here, and does it pay off? | Where should we build? |
| Scale | A neighborhood or serving area or town | A city, county or region |
| Input | Addresses, streets and other input data | Just an area boundary. FOND provides the rest. |
| Output | A network plan, BOM and financial report | Scored subareas, a plan for each chosen subarea, and business cases for all of them on one page |
Instead of creating many Fiber Planner projects and reports one by one, Market Lens creates them in bulk and shows all the results together.
How the steps work
The design panel has three steps: Work area, Assess and Plan. Assess and Plan open once your subareas exist. Plan is optional.
Before you start
- Your workspace needs a Fiber Planner subscription that includes Market Lens, with enough Planner quota for the subareas you want to plan. You also need a platform seat.
- Market Lens builds subareas from US census data, so it works for areas in the USA.
Step 1: Create a Market Lens project
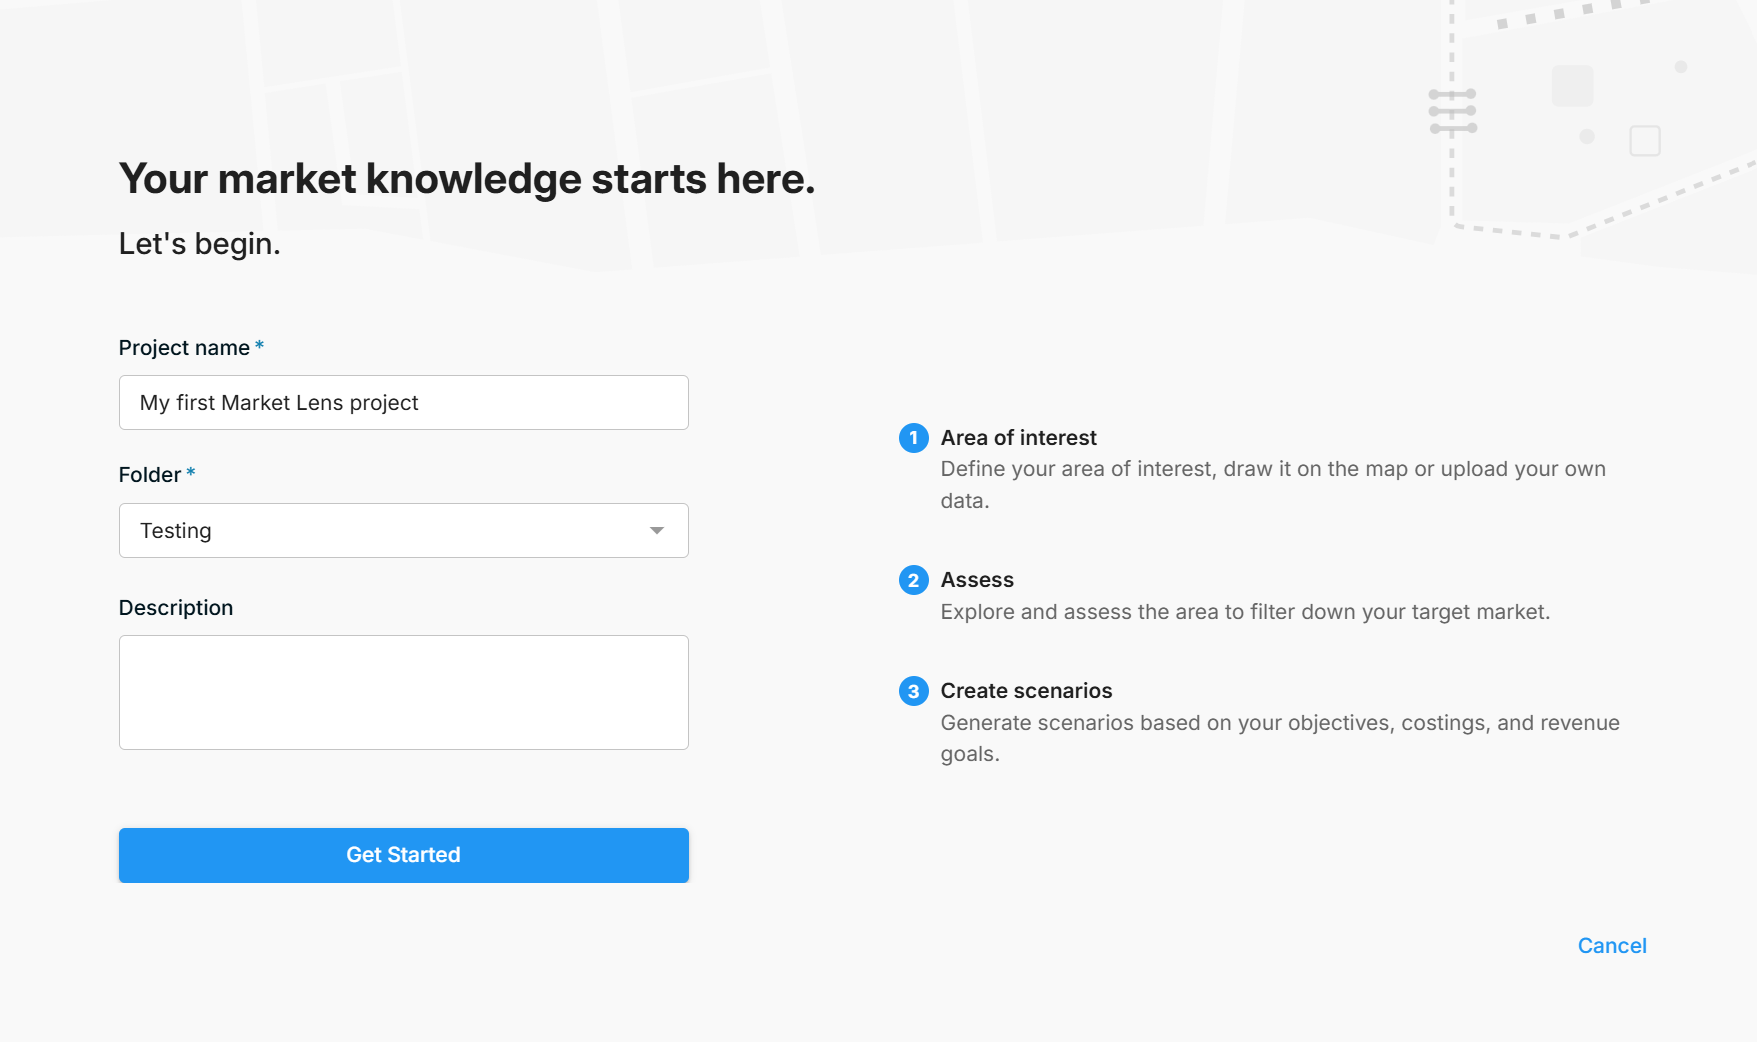
- On the home page, click Create and choose Market Lens Project.
- Enter a Project name, choose a Folder, and add a Description if you like.
- Click Get Started.
The project appears in your project list as a Market Lens project. The subarea projects you create later are kept inside it.
Step 2: Define your work area and subareas
- In the Work area step, click Identify subareas.
- Draw your area of interest on the map, or upload it as a Shapefile, TAB, KML or GeoJSON file.
- FOND divides your area into subareas based on US census block groups.
- Under Subarea configuration, choose how big your subareas should be:
- Use census block groups as-is: one subarea for each census block group.
- Combine into larger subareas: merge block groups into subareas of roughly the number of premises you choose, from 500 to 9,000. The default is 6,000.
- Check the list of subareas and their address counts. Click a subarea’s name to rename it. A red warning icon marks any subarea with more than 10,000 premises, which is the limit for a single plan.
- Click Finish.
Tip: Use larger subareas when assessing large market areas. The more subareas you have, the slower your browser may be while it processes all of the data.
Step 3: Assess your subareas
This step helps you narrow a large market down to the subareas worth planning.
Explore the data
Turn on Overlays to show FOND’s built-in data layers in the Legend:
| Group | Layers |
|---|---|
| Subareas | Colored by score (default) or by name |
| Base data | Addresses by type, and streets by road type |
| National Broadband Map | Fiber footprint, maximum download speeds, and coverage by provider and technology (FCC data) |
| Demographics | Median income and unemployment rate (US Census) |
| Densities | Addresses per square mile, addresses per linear mile, and linear feet per address |
| Soil | Minimum bedrock depth |
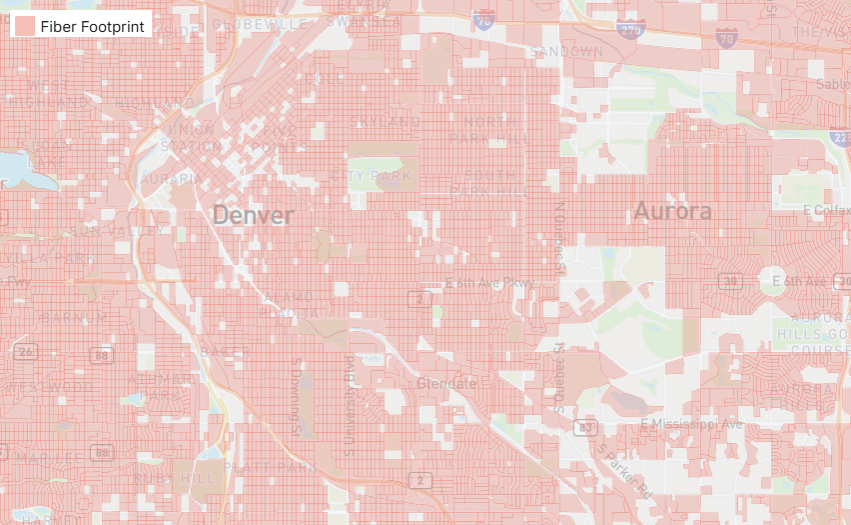
Click Show data citations in the Legend to see the source of each layer.
Click a subarea on the map to see its details in the Properties panel, including its score, addresses, densities, income and fiber coverage. The Features table shows the same figures for every subarea, and you can export it to CSV or Excel.
You can also add your own reference data, such as middle-mile routes, as overlays.
Score your subareas
Each subarea gets a score from 0 to 100, based on the criteria you choose. To change them, click Edit under Scoring inputs.
| Cost factors | Revenue factors |
|---|---|
| Addresses per area · Addresses per linear distance | Proportion underserved · Avoid fiber coverage · Median income · SDU proportion · Avoid a specific provider |
Set each criterion’s importance from Not Important to Very Important, add or remove criteria, and watch the rankings update. Click Save when you’re done. New projects start with addresses per area, proportion underserved and median income, all at medium importance.
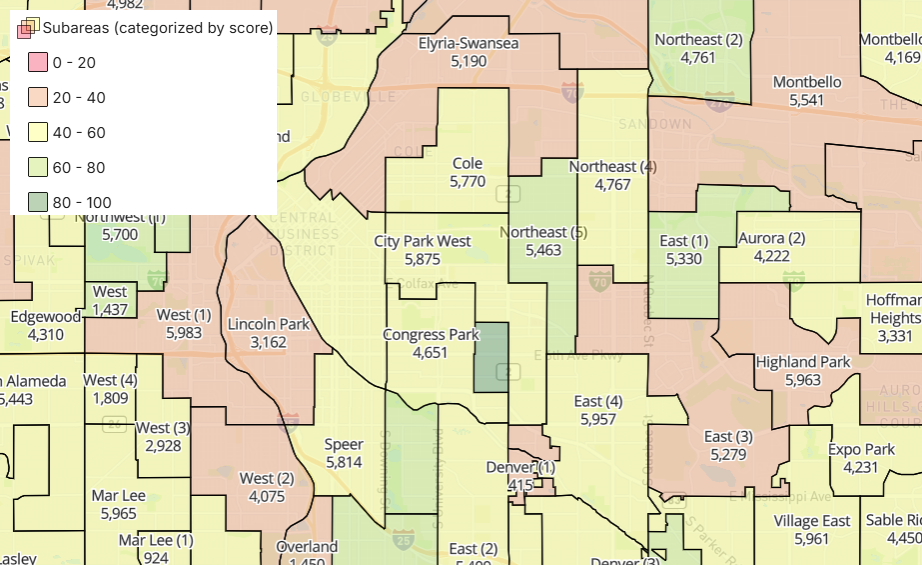
The Score board lists every subarea from highest to lowest score.
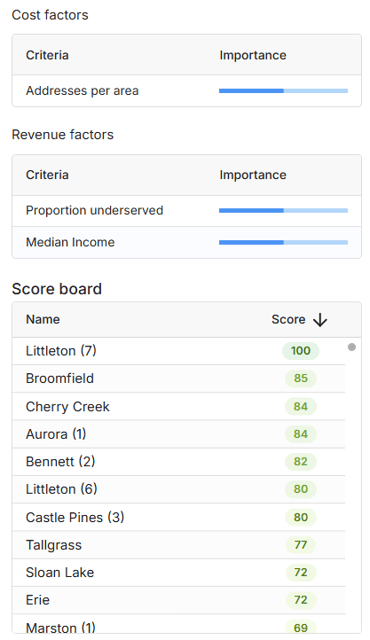
The scores show on the map.
Step 4: Choose an architecture
In the Plan step, click Select architecture and apply one of your workspace’s architectures. It’s the same architecture you’d use in a Fiber Planner project. Every subarea project will use it.
More information: How to configure an architecture · Fiber allocation and the Demand Model
Step 5: Create subarea projects
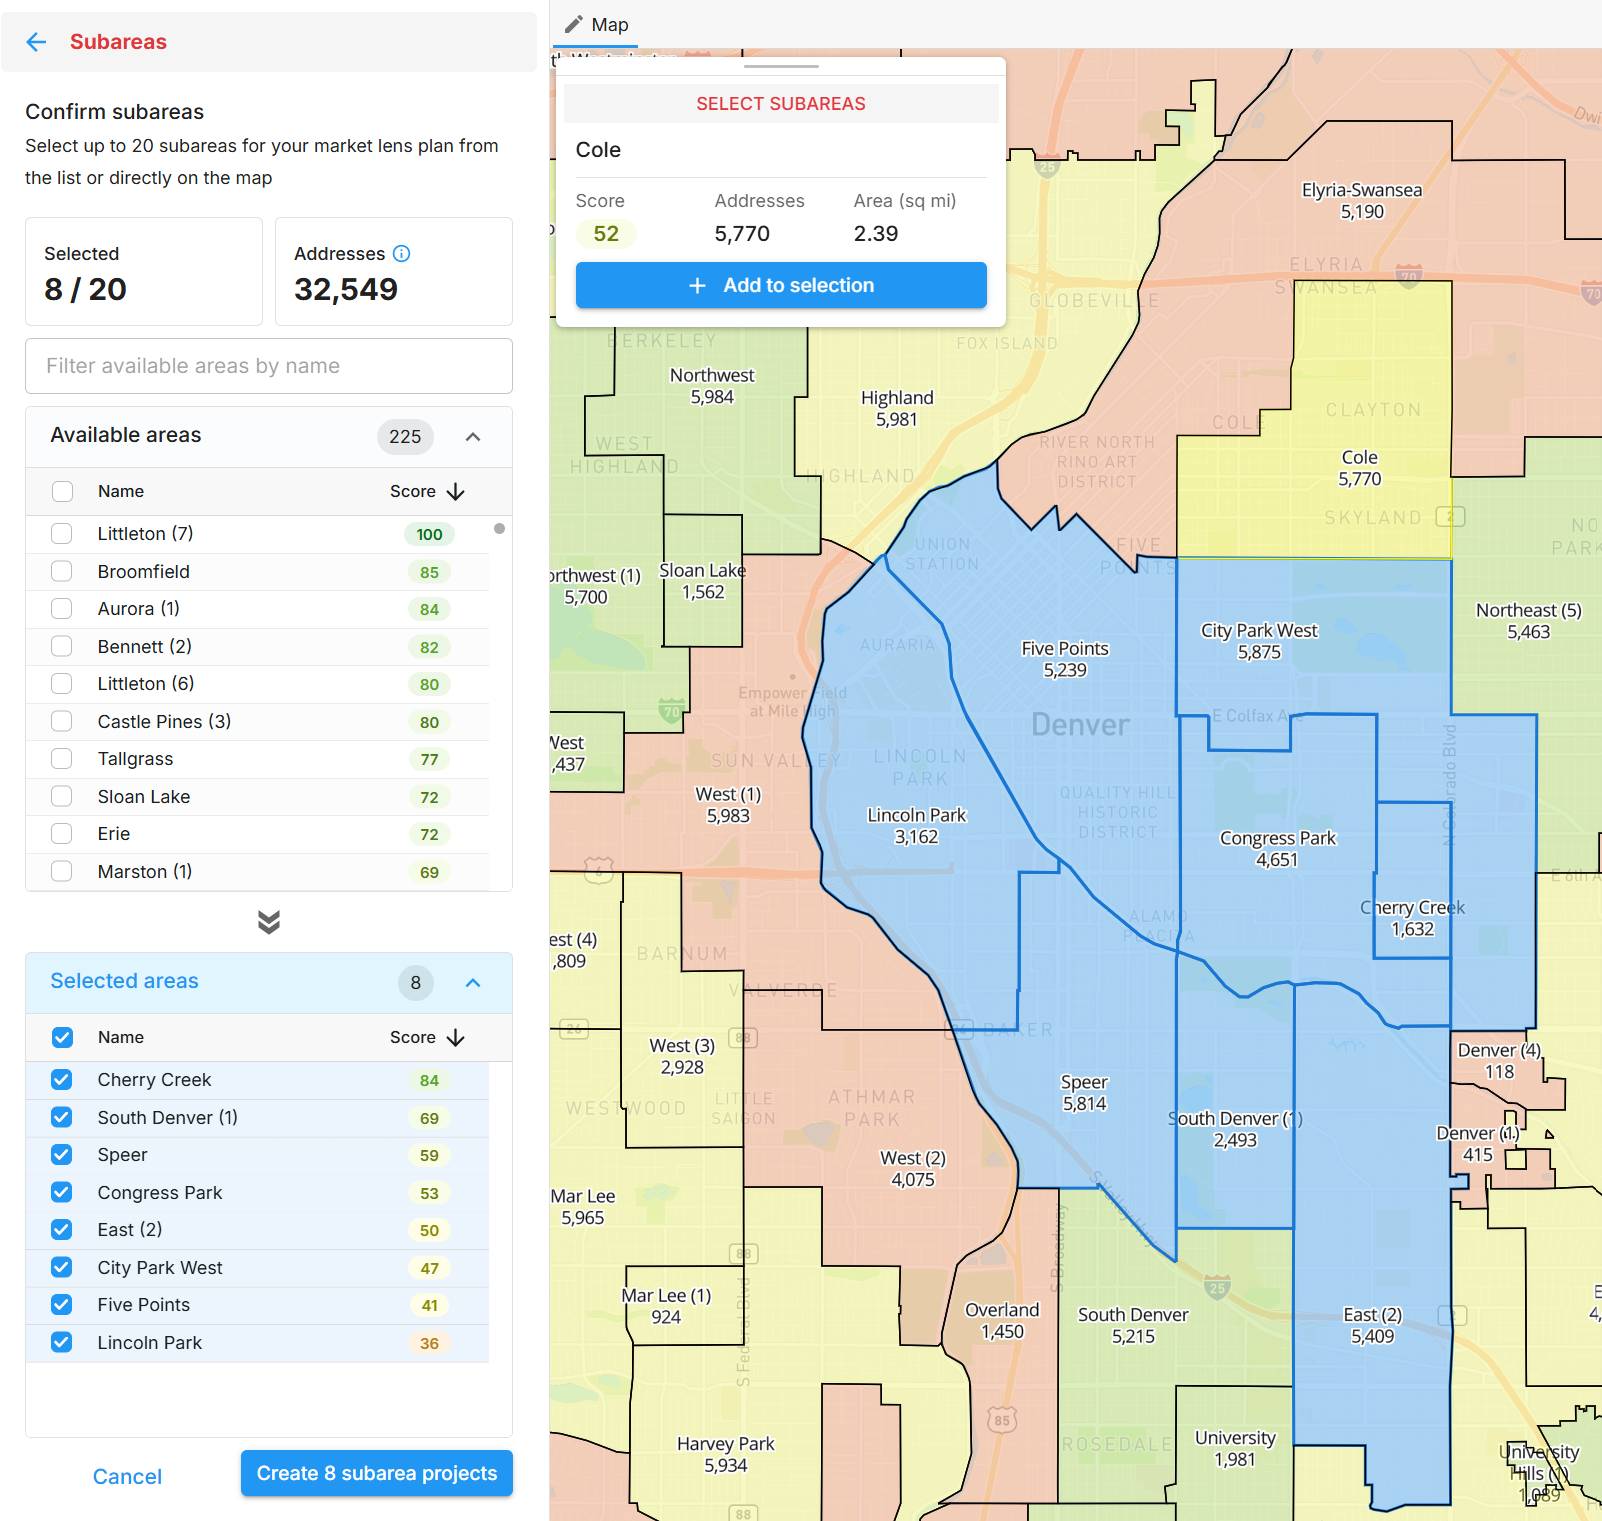
- Under Planner, click Select available subareas.
- Choose up to 20 subareas from the list, or click them on the map. The map pop-up shows each subarea’s score, addresses and area.
- Check the address estimate against your remaining Planner quota.
- Click Create N subarea projects.
FOND creates a Fiber Planner project for each subarea, then generates its plan. You can come back and create more projects from the remaining subareas, up to 20 at a time.
Subarea projects work like other Fiber Planner projects, with a few differences:
- They don’t have versions
- They can’t be copied, moved or deleted on their own
- Their architecture can’t be changed
Open any of them to review or refine its plan.
Step 6: Create a report
Once the plans are ready, create a business case for all your subarea projects at once.
- Under Reports, wait for All designs are complete. You can start as soon as Some designs are ready, but only completed designs are included.
- Click Create report.
- Configure the report on the General, Revenue, OPEX and Resource allocation tabs. You can also import the configuration from an existing report.
- Click Generate.
Settings apply to each subarea separately. For example, a total budget of $1M gives each subarea a budget of $1M, not $1M shared between them.
More information: Generating your first report · Minimum report requirements
Step 7: Review the results
Open the Market Lens hub by clicking the Market Lens folder in your project list, or View market lens projects.
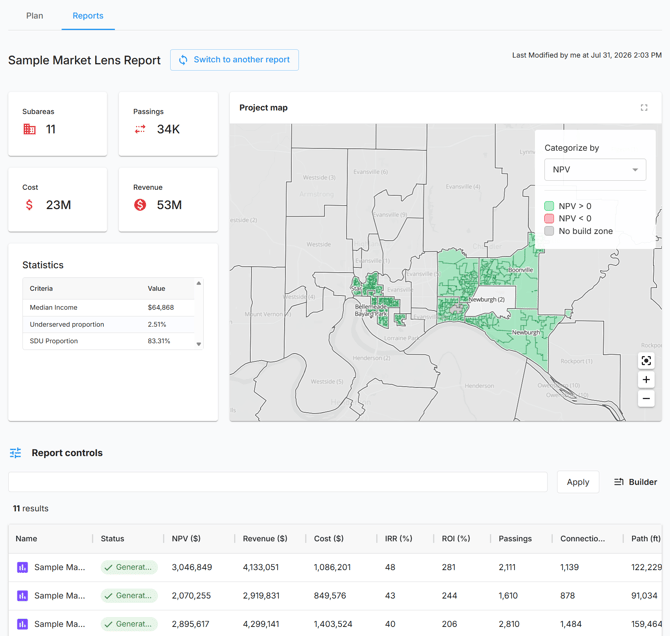
- Plan tab: totals for subareas, premises, path and area, a map, and a list of your subarea projects.
- Reports tab: headline figures for passings, cost and revenue across all subareas, and a map colored by NPV, IRR, ROI, cost per foot or cost per passing. The Report controls table compares every subarea side by side and can be sorted and filtered.
Use Switch to another report to compare reports with different settings.
Step 8: Share and export
- Share the Market Lens project, or individual reports, from their menus.
- Export subarea data from the Features table by right-clicking it.
- Open a subarea project to export its plan and BOM.