Cost to serve presents costs in several ways to answer some of the following questions:
- What share of the cost is attributable to a specific address? Which addresses are within an acceptable threshold?
- What is the minimum cost to build to a specific address? Or to this region of the network?
- How much would I save if I removed an address or addresses?
- How much does it cost to build this particular address?
Cost to serve looks at the capital expenditure required for a network build, and how that cost might be distributed throughout the design to create a cost profile that informs better decisions. Cost to serve refers to a particular address.
The costs are applied from the Bill of Materials to the network elements and trace them out to see the breakdown of your costs in order to visualize high and low-cost areas. Therefore, it is very important to invest time in setting up your BOM correctly so that all important elements are counted and costed.
For further detail on how to configure your Bill of Materials, review Configuring your BOM
A traditional costing method provides a general view of cost but does not attempt to distribute costs fairly between addresses, making it difficult to make localized decisions. They may provide some information about which parts of the network are more expensive to build than others, and how changes to the design might impact cost. Typically, traditional costing methods involve the total cost, the number of addresses, and the average cost per address.
In FOND, we improve upon traditional costing methods by visualizing the true distribution of costs throughout the network. We produce three cost types defined as individual cost, shared cost, and accumulated cost, which are calculated from the cost lines in your BOM and then displayed within your legend, the feature table, as well as each individual address feature on the map.
Individual Cost
The individual cost is the portion of the cost that is solely attributable to each address. This identifies the cost of design elements that support a single address, and nothing else. It helps to identify high-cost contributors. Not building an address would reduce the total build cost by the amount of the address’s individual cost.
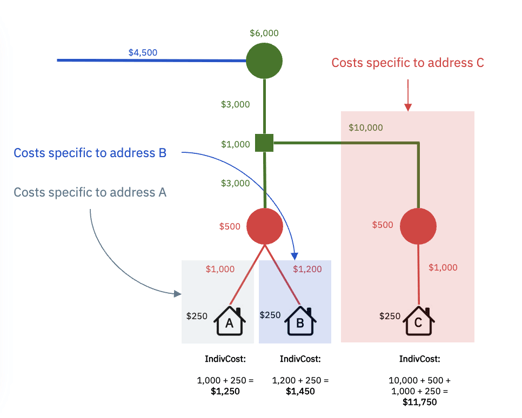
In this video, you can see the varying differences of the individual cost for these addresses.
Shared Cost
The shared cost is the portion of the total build cost that is attributable to each address. This is achieved by distributing the element cost of each design element equitably between the addresses that rely on it.
The shared cost values represent the total cost of the Bill of Materials (BOM), serving as a more precise alternative to an average cost. Unlike the traditional approach that determines equal portions for every address, shared cost calculates costs distribution based on dependencies, resulting in varying costs across addresses. This approach enables more meaningful localized decisions, with some costs being high and others low.
The shared cost value provides clear insight into which addresses are more expensive than others to build, to better inform decision making. Note that the shared cost of each address does include the costs solely attributed to individual addresses, in addition to the shared equipment costs.
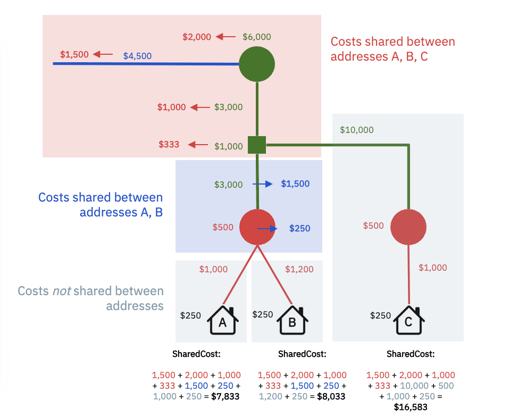
This video highlights the varying differences of shared costs of these addresses in a residential area.
Accumulated Cost
The accumulated cost of an address is the entire cost to build all upstream dependencies. To build service to one address, the accumulated cost will be incurred as the minimum total cost.
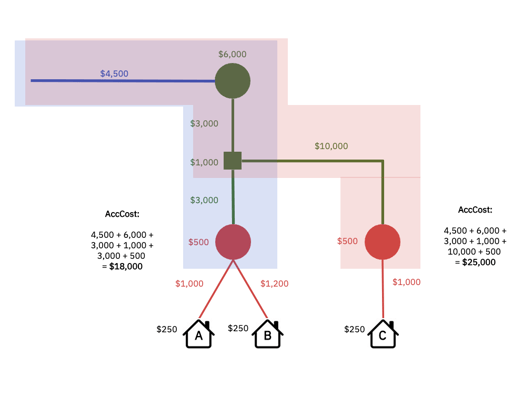
In this video, you can see accumulated costs are in the lower costing bands for addresses closer to the central office (OLT).
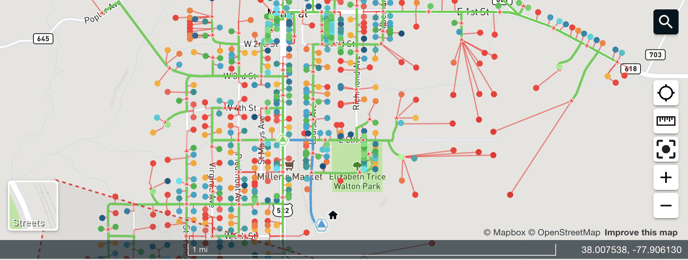
These cost bands are represented visually on your network design, mirroring the appearance of a heat map. In essence, this breakdown allows for an easily interpretable presentation of the individual costs, shared costs, and accumulated costs throughout your network design, providing a clearer understanding of the financial landscape associated with each component.