Inspecting the design
How to make the most of FOND to inspect and review the output.
We'll be using a lot of terminology specific to FOND, so we recommend checking out our network design elements glossary if you haven't already.
Moving around the map
Please read Moving around the map in FOND for full details.
Show layer totals
The information icon in the legend provides a quick snapshot of the total count (or length) or elements in your Input Data and Network Design.
.png?width=275&name=3(1).png)
Feature pop-up
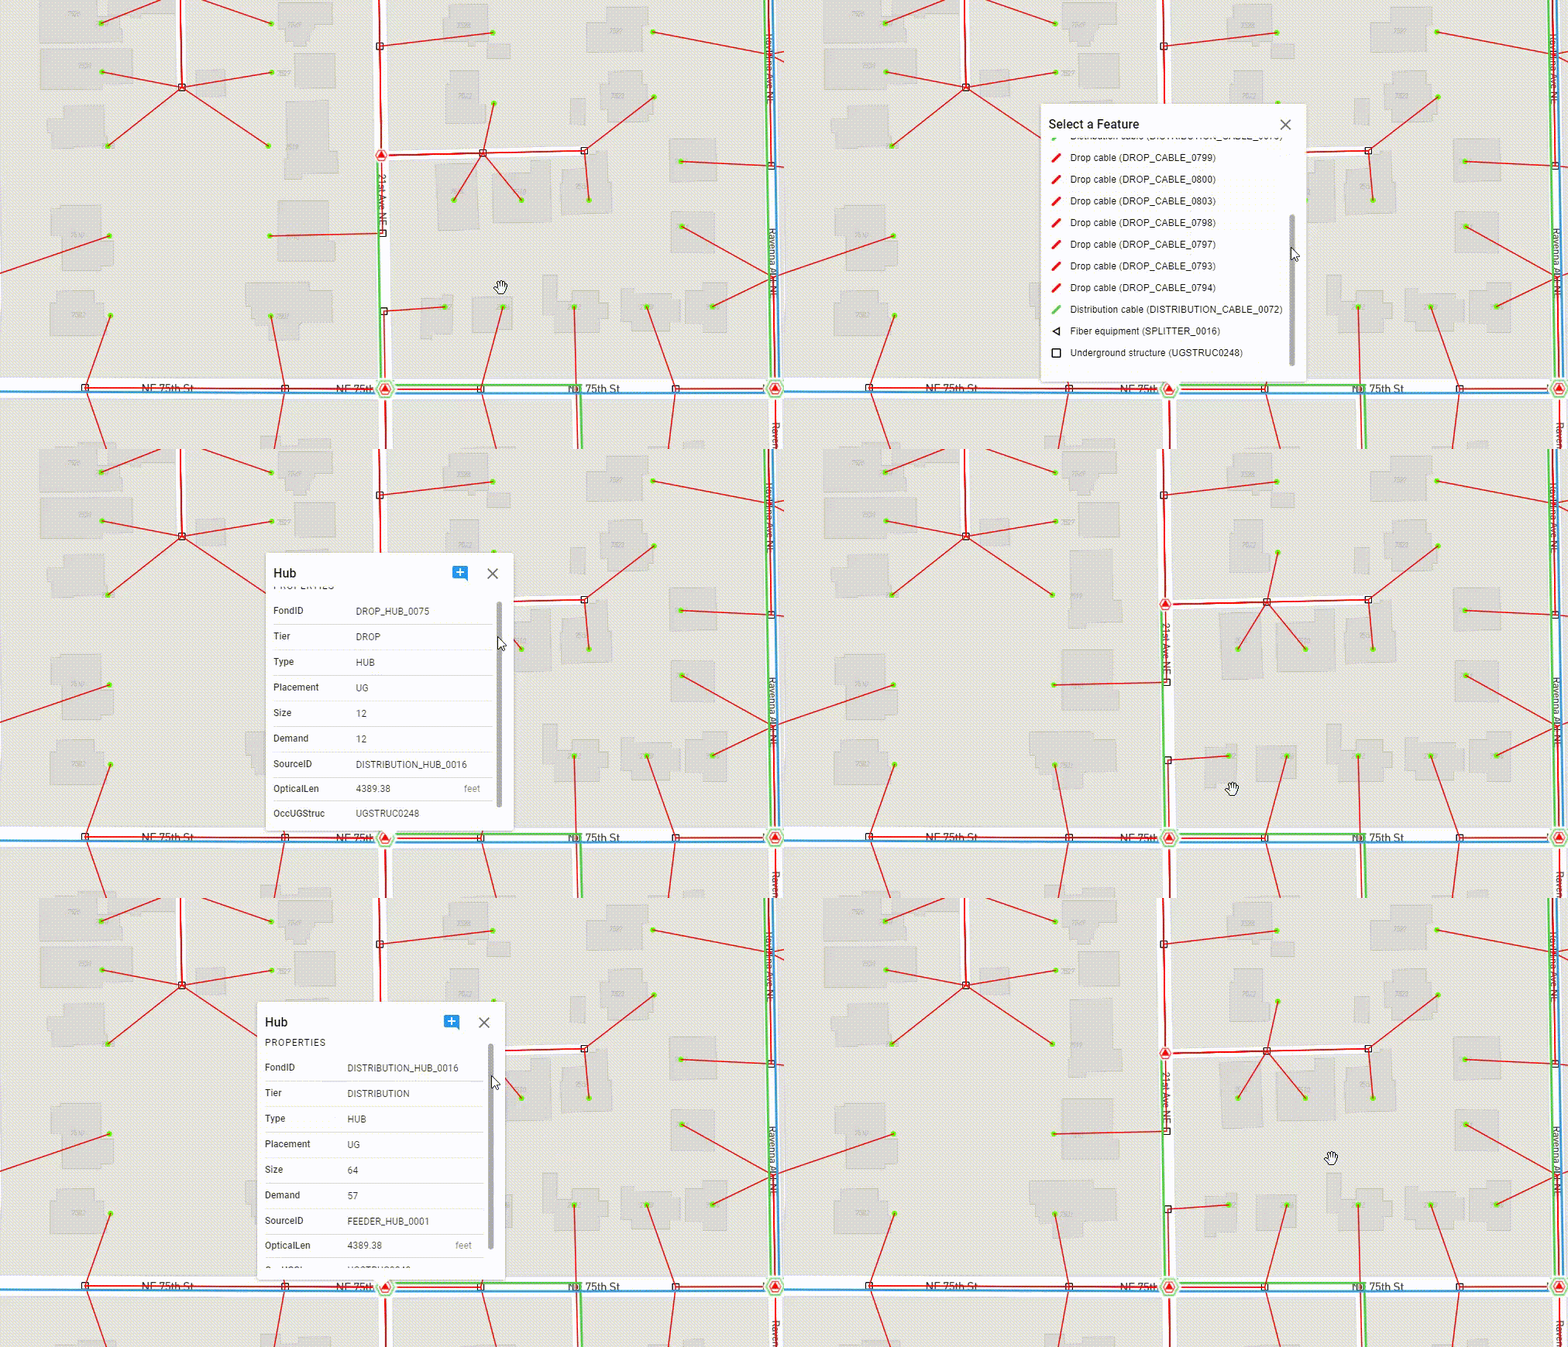
You can click on any features on the map (Input data or Network design elements) to view information about them. When there are multiple features in one location, FOND will display a list. You can select any item from the list to see the full set of attributes for that feature.

View sub groups
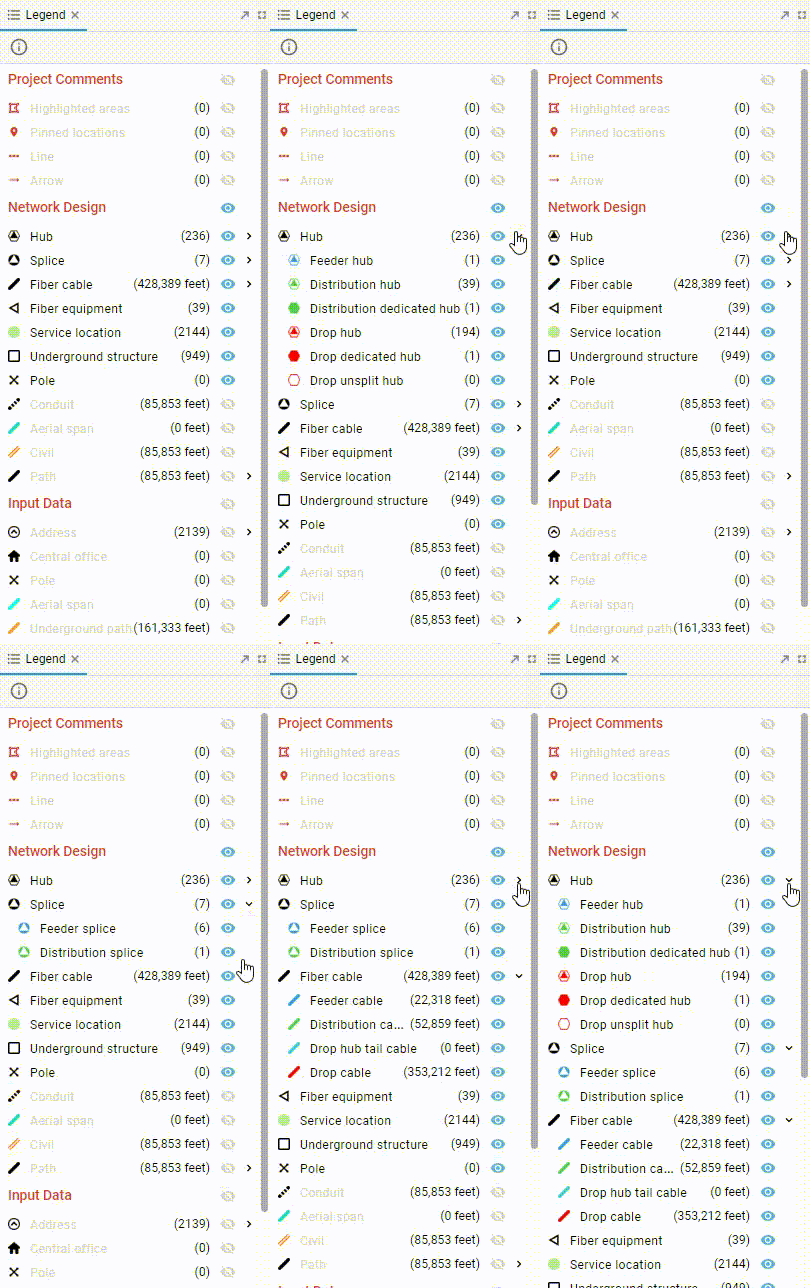
Some layers, like Hub, Splice, and Fiber cable, are grouped by Tier. The arrow icons in the legend allow you to expand each layer to view the sub groups.

Toggle layer visibility
Use the legend to turn off the layers you don't need to see. Clicking on a layer name or the eye icon toggles it on and off. This makes it easier to view and click on the features that you're really interested in.
A good place to start is by turning off everything except the Drop Hub, Drop Cables, and Service locations.
.gif?width=688&name=3(2).gif)
Here is a workflow that we recommend for inspecting a network tier-by-tier.
Step 1: Inspect the Drop network
|
Turn on:
|
Some things to look for:
|
Step 2: Inspect the Distribution network
|
Turn on:
|
Some things to look for:
|
Step 3: Inspect the Feeder network
|
Turn on:
|
Some things to look for:
|
View layer attributes for all features
Rather than clicking to inspect each feature individually on the map, the Features widget allows you to view all layer attributes in a tabular format. In the default project layout, Features are available at the bottom left of the screen:
.png?width=164&name=3(3).png)
Tips for using the Features table:
- The table will display at the bottom of your screen and can be resized and moved if needed
- Select any layer or layer subgroup from the list on the left hand side
- Search the table for attribute values (e.g., a feature with a specific FondID, or parcels with a particular LandUse)
- Select a feature (or many features) and Highlight or Zoom to them on the map
- Click on a field name to Sort a field by ascending or descending value
Common use cases for the Features table:
- Identify addresses with a high NumFibers value
- Identify Service Locations and Hubs with a high OpticalLen
- Identify hubs with low Demand count (low utilization)
- Identify cables over a certain length
.gif?width=688&name=3(4).gif)
Measuring features on the map
There are two ways to measure on the map.
For accurate measurements, click on the ruler icon to begin measuring on the map. Click on the map for each new node/vertex, and double click to complete the measurement. Your measurement will be visible in the bottom left of the screen..gif?width=688&name=3(3).gif)
For a quick reference, there is also a scale bar at the bottom of the page
.png?width=688&name=3(2).png)